How to Use Google Sheets to Track Stocks

Did you know you can track stocks in Google Sheets? Using a function and a few attributes, you can automatically get the details you want.
You may not realize it, but Google offers a function that allows you to track stocks in Google Sheets. Whether you want real-time prices or historical information, you simply enter the function, ticker, and attributes.
This is a good way to keep track of the stocks that interest you or review their open, close, high, or low over time. We’ll show you how to enter the function, use some of the most common attributes, and point you to the complete list of real-time, historical, and mutual fund attributes for those one-off scenarios.
Using Google Finance to Track Stocks in Google Sheets
The function you’ll use to obtain the stock data is GOOGLEFINANCE. So you’ll select a cell, enter an equal sign followed directly by GOOGLEFINANCE and then include the ticker symbol and optional attributes.
The syntax for the formula is:
=GOOGLEFINANCE(ticker, “attribute”, DATE(start_date), DATE(end_date|number_of_days), “interval”)
As you can see, the only requirement for the function is the ticker. Everything else you see in the formula is optional. And we’ll go through these options below.
Google also recommends that you precede the ticker symbol with the exchange symbol to obtain the exact results you want. You can, however, leave the stock exchange out of the formula and let Google choose one for you.
For example, if you want the current price for Google, you can enter either of the following:
=GOOGLEFINANCE(“GOOG”)

=GOOGLEFINANCE(“NASDAQ:GOOG”)


Inserting Attributes
After the ticker symbol, you can enter an attribute for the exact data you want, such as price, high, low, or volume. You’ll enter the attribute within quotation marks.
For example, if you want the price as of market open for Apple, you would enter:
=GOOGLEFINANCE(“AAPL”, “priceopen”)


The available attributes vary depending on if you want real-time, historical, or mutual fund data. Here are some of the most common attributes:
- price: real-time
- priceopen: real-time
- high: real-time and historical
- low: real-time and historical
- volume: real-time and historical
- marketcap: real-time
- tradetime: real-time
- change: real-time and mutual funds
- changepct: real-time and mutual funds
- returnytd: mutual funds
- netassets: mutual funds
For a complete list of attributes for real-time, historical, and mutual fund data, head to the GOOGLEFINANCE function help page.
Adding Dates
If you want to go back in time, you can add dates to the formula. You can enter a start date with or without an end date. If there’s no end date, you’ll simply get the start date’s data. You can also enter a start date with a number of days from that start date or use “TODAY”.
The dates themselves must be within parentheses, and the start date always comes first. Here are a couple of examples.
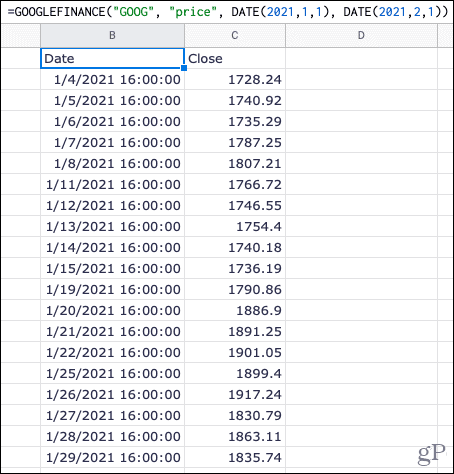
This formula provides Google’s price each day from January 1, 2021 through February 1, 2021.
=GOOGLEFINANCE(“GOOG”, “price”, DATE(2021,1,1), DATE(2021,2,1))


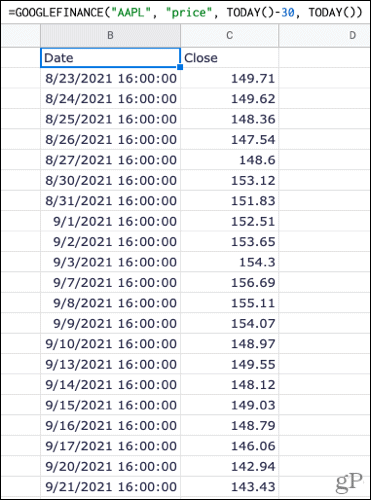
This formula provides Apple’s price today and goes back 30 days.
=GOOGLEFINANCE("AAPL", "price", TODAY()-30, TODAY())

Including an Interval
One more optional piece you can add to the GOOGLEFINANCE function is an interval. This is helpful for viewing prices, highs, or lows per day or week within a date range.
Here are a couple of examples.
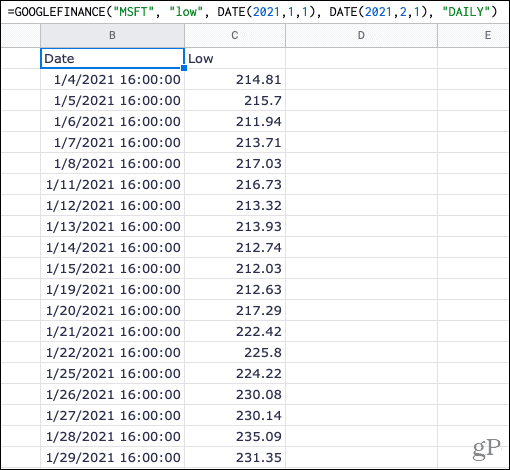
This formula provides Microsoft’s lows for each day in the month of January 2021.
=GOOGLEFINANCE("MSFT", "low", DATE(2021,1,1), DATE(2021,1,31), "DAILY")

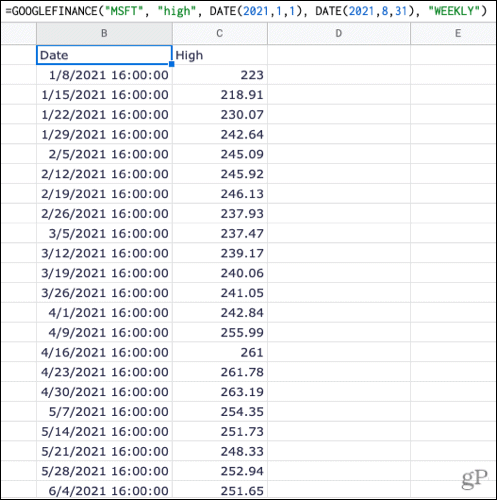
This formula provides Microsoft’s weekly highs from January through August 2021.
=GOOGLEFINANCE("MSFT", "high", DATE(2021,1,1), DATE(2021,8,31), "WEEKLY")

Getting a Quick Current Price
If you have a spreadsheet in Google Sheets with stock symbols already entered, you can get a quick, real-time price using the function and a cellreference.
For example, if you have Apple’s stock symbol in cell A2, you would use:
=GOOGLEFINANCE(A2)
This would display Apple’s current stock price in the cell with your formula.


About the Data Obtained From Google Finance
While most times you’ll see the stock data in your sheet update before your eyes, Google states that information can be delayed up to 20 minutes. In addition, not all stock exchanges are sourced when obtaining the data.
For more details, take a look at Google Finance’s listing and disclaimers.
Stock Information at Your Fingertips in Google Sheets
If you watch the market, are interested in a particular company, or are just curious how prices have changed, open Google Sheets and start gathering stock details easily. Will you give it a try?
1 Comment
Leave a Reply
Leave a Reply


Ramcharan
June 13, 2024 at 7:22 pm
thats great info. Is it possible to get a whole list of over 1000 stocks?