How to Create a Gantt Chart in Google Sheets

A Gantt chart is a useful way to measure the time taken to complete certain tasks. If you want to create a Gantt chart in Google Sheets, follow this guide.
A Gantt chart is a commonly used chart that illustrates the breakdown of special projects against various time periods. You can create these using a spreadsheet tool like Excel or Google Sheets.
If you want to create a Gantt chart in Google Sheets, you’ll need to follow a few steps first. Here’s how.
How to Create a Gantt in Google Sheets
To help you create a Google Sheets Gantt chart, we’ll use a basic example that shows the time taken to complete a list of common tasks. You can modify the steps below to suit your own spreadsheet data and requirements.
Inserting Your Data
First, you’ll need to create a basic table for your chart to refer to. To do this:
- Open a new or existing Google Sheets spreadsheet in your browser.
- Create a new small table and insert a few headings to get started.
- For instance, you’ll need heading cells first. Next, enter a value for tasks, a start date, an end date, and any other project details.

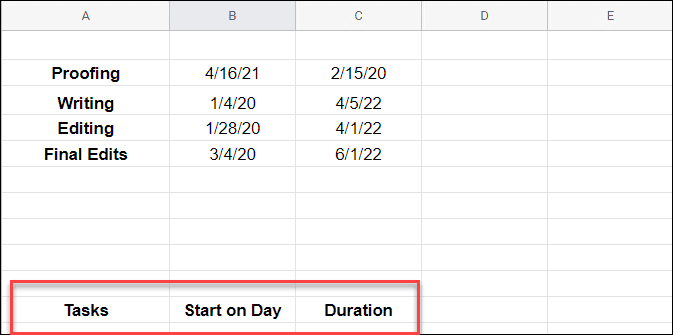
- Next, copy and paste the same data below the original sheet or to another section of the sheet. It will serve to calculate graphs in each portion of the Gantt sheet.

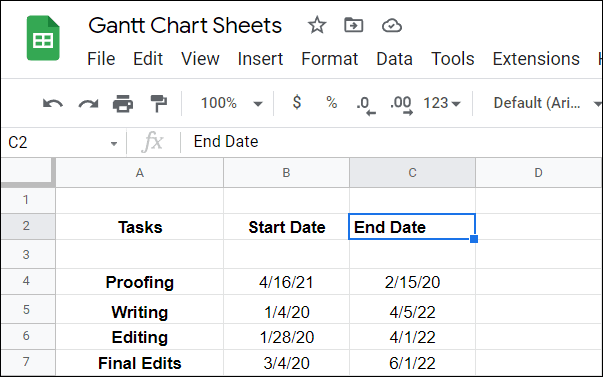
- Now, you need to calculate the start of the day. It would be best if you found the difference between each start date and the ending date of the first task. Remember, enter the following in the Start on Day field in the secondary table you created.
=INT(B4)-INT($B$4)


- Click on the Start on Day cell again and then double-click the little blue square that appears next to the cell.


- Next, you need to calculate the duration for how long each task will take. This is a more complex formula, but it finds the difference between other variables. It needs to be (<CurrentTaskEndDate>-<FirstTaskStartDate>)-(<CurrentTaskStartDate>-<FirstTaskStartDate>) and looks like the following:
=(INT(C4)-INT($B$4))-(INT(B4)-INT($B$4))

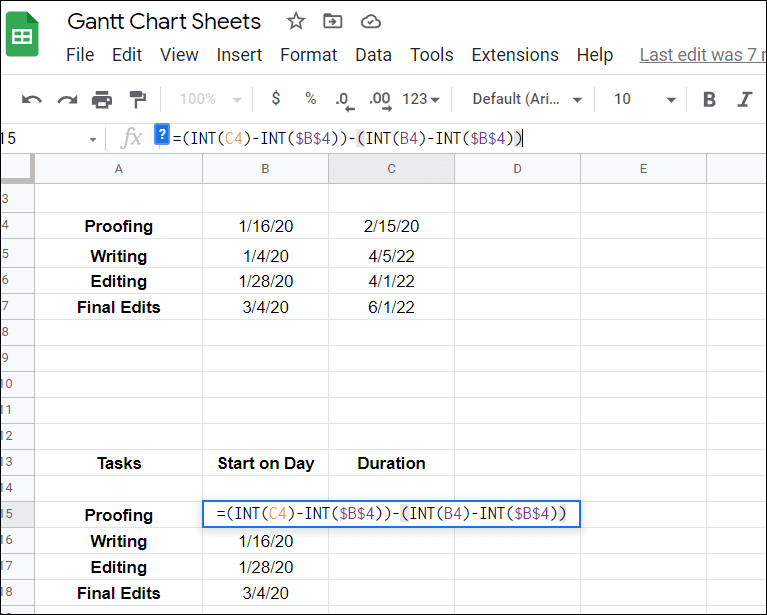
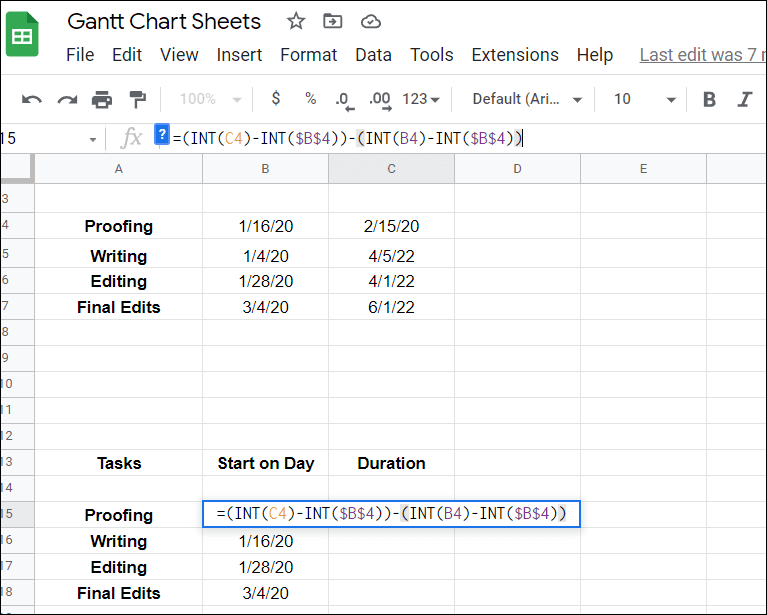
- After you press Enter, click the cell again and double-click the blue square next to the cell. That will fill in the remaining cells for it.

Creating a Gantt Chart in Google Sheets
With your data in place, you can insert your Gantt chart in Google Sheets.
To create your Gantt chart in Google Sheets:
- Highlight your data in Sheets and select Insert > Chart.

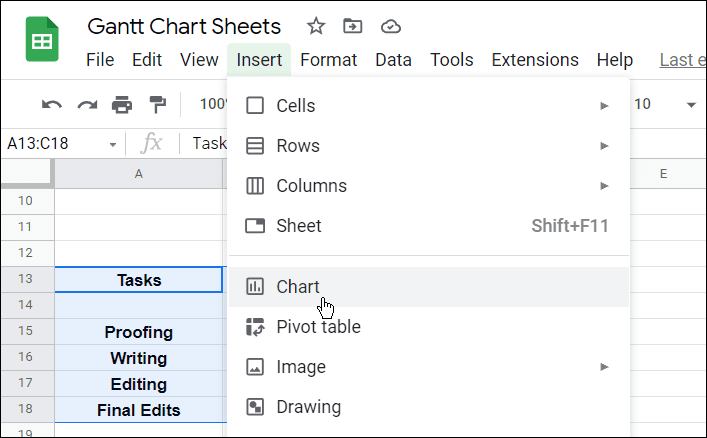
- Under Chart editor on the right side, select Stacked Bar Chart.


- Select your Gantt chart and select the Customize option on the menu on the right.
- Under the Chart & axis titles section, give your chart a name.


- That’s all there is to it. Now you have your Gantt Chart displaying your data calculated by the Google Sheet you were working on.


Creating Charts in Google Docs and Microsoft Office
Creating a Gantt chart in Google Sheets provides you with a list of projects against periods of time taken to complete them. Typically, it’s used as a bar chart that illustrates the breakdown of a project, tasks, or events against time. Creating a Gantt chart in Google Sheets is helpful when you make a Gantt chart for a business or team project.
Creating a Gantt chart isn’t the only thing you can do either. For example, you can create and customize a chart in Google Sheets or insert an image into a Google Sheets cell. If you’re a Microsoft Office user, check out how to create a Gantt chart in Excel or create a Scatter Plot in Excel.
Leave a Reply
Leave a Reply


